
| Quick answer:
Business intelligence helps therapy practices connect patient access, provider performance, clinical outcomes, and revenue cycle results in one decision framework. The most useful dashboards do more than display a number. They define the metric, reveal where performance varies, and help the right owner decide what to do next. Every therapy practice has blind spots. A referral source can slow down, open appointments can remain hidden inside a seemingly full schedule, documentation can lag, or denials can repeat before the pattern becomes visible. These are rarely isolated people problems. They are visibility problems. Business intelligence closes that gap by connecting data from the front desk, clinic, and revenue cycle. The goal is not to give leaders more reports to manage. It is to help them identify a risk early, understand its cause, and assign an action while there is still time to change the result. |
What business intelligence should do for a therapy practice
A useful analytics program starts with the questions leaders need to answer. Are new patients reaching an evaluation quickly? Are schedules truly full? Are patients completing their plans of care? Are clinicians documenting efficiently without sacrificing quality? Is the organization collecting the revenue it reasonably expects?
Those questions cross departmental lines. A cancellation trend can reduce access, provider utilization, plan of care adherence and revenue at the same time. A denial pattern may begin with documentation, eligibility or configuration long before it reaches the billing team. When each department sees only its own report, the organization sees fragments. Business intelligence becomes valuable when those fragments are connected.That’s why Raintree BI is organized around the practice rather than the report library. Its 15 dashboards and more than 275 reports are grouped by the teams who use them: front office and patient access, revenue cycle management, clinical quality, and an executive view that brings it all onto one screen
Start with a shared definition of every metric
A dashboard cannot drive alignment if every user interprets the same number differently. What counts as a denial? When does a lead become a patient? Does capacity measure booked hours, available appointment slots or both? Small differences in definition can produce large differences in decisions.
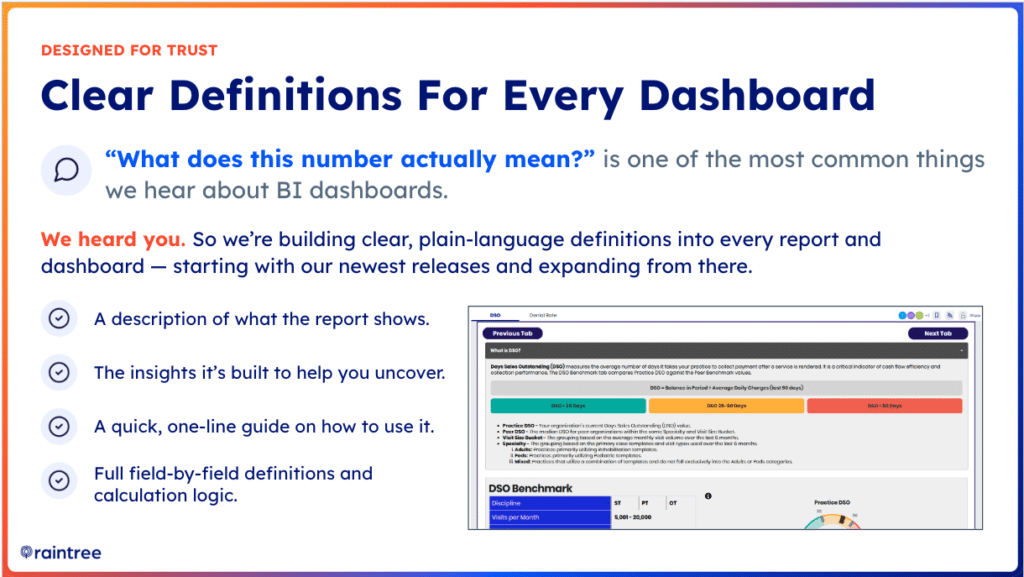
Raintree is addressing this problem by adding plain-language data dictionaries to dashboards and reports starting with the newest releases. A useful data dictionary should explain what the report measures, which insights it can uncover, how the user should apply it and the logic behind each field. That context reduces guesswork and helps operational, clinical and financial teams work from the same definition.
The same principle should guide internal reporting: answer the basic question clearly before asking the reader to interpret a chart. If a metric cannot be explained in one or two sentences, it is not yet ready to guide action.
Follow the patient from lead to attended evaluation
Lead conversion is often measured when a lead record reaches a particular stage. That is useful, but it can overstate true access if the patient never schedules or attends an evaluation. A stronger conversion view follows the journey from lead entry through the first kept visit.
The new lead-to-patient reporting demonstrated by the Raintree BI team separates leads that converted, leads that entered a workflow but have not converted and leads that have not been worked. It also looks beyond the scheduled evaluation to whether the appointment was kept, canceled or missed.
That distinction helps leaders locate the actual constraint. A large unworked queue points to intake ownership. A long delay between case creation and evaluation suggests a scheduling or capacity issue. Strong scheduling with weak attendance may call for reminder, transportation, timing or patient engagement changes.
Find operational leakage before it becomes a larger problem
Operational dashboards should surface the exceptions that deserve attention, including active cases with no future appointments, elevated cancellation or no-show rates, unsigned documentation, delayed evaluations and unused appointment slots.
Capacity deserves special care. A provider can appear to be above 100 percent capacity because of double booking while still having open time elsewhere in the schedule. The upcoming slot availability view answers a different and often more actionable question: where can another patient actually be scheduled? Reading booked capacity and open slots together gives leaders a clearer basis for demand generation, waitlist management and staffing decisions.
The drill-down is what turns an alert into an intervention. Leaders should be able to move from enterprise performance to region, location, provider, case type, payer or patient detail, depending on the question. A systemwide average may look healthy while one clinic or workflow creates most of the leakage.
Balance provider productivity with clinical quality
Provider performance should never be reduced to visit volume alone. Visits per day, visits per hour, billable minutes and utilization matter, but they need to be read beside documentation time, plan of care adherence, patient experience and clinical outcomes.
The Provider Scorecard previewed in the session organizes performance into three practical lenses: quality, documentation and productivity. This structure supports a better coaching conversation. A clinician with low visit volume may have open capacity, poor arrival rates or an unusual case mix. A clinician with slower documentation may need workflow support, while another may need guidance on note quality or compliance. The scorecard helps leaders investigate before drawing a conclusion.
Used well, provider analytics should help leaders allocate resources, identify training opportunities and reduce burnout risk.
Make clinical outcomes measurable and comparable
Patient-reported outcomes give therapy organizations an objective way to demonstrate clinical value, but only when teams collect them consistently and interpret different instruments in a comparable way.
The Raintree BI Patient Reported Outcomes dashboard standardizes supported outcome questionnaires to a common 0 to 100 scale and compares change against the minimal clinically important difference (MCID). Closed-case views show historical performance, while active-case views identify patients or providers with incomplete follow-up assessments before discharge.
Internal benchmarking can reveal which locations or providers consistently produce strong functional improvement. External benchmarking can place results beside an anonymized national dataset. Together, these views help leaders answer two different questions: Are patients improving, and are clinicians collecting enough follow-up data to prove it?
Objective outcomes can strengthen quality improvement, value-based care reporting, and payer conversations. A baseline score without a follow-up score, however, cannot demonstrate change. Collection discipline is part of the analytics strategy.
Benchmark revenue cycle performance against relevant peers
Days sales outstanding and denial rate are most useful when a practice can interpret them in context. A target copied from an unrelated organization may be unrealistic because specialty, discipline, payer mix, and visit volume influence revenue cycle performance.
Raintree BI’s RCM benchmarking approach compares a practice with an anonymized peer cohort matched by factors such as specialty, discipline, and clinic visit volume. Leaders can view current performance, compare it with the peer median, and follow the trend over time. Filters by location, financial class, and primary insurance help isolate the payers or workflows driving the gap.
This replaces arbitrary targets with a more defensible baseline. If DSO or denial performance trails comparable peers, the RCM team can direct staff toward the payers and processes most likely to improve cash flow rather than spreading effort evenly across every account.
Move from historical reporting to predictive insight
Traditional reporting explains what has already happened. Predictive analytics helps leaders estimate what is likely to happen next. The Factoring Premier capabilities discussed in the session use historical adjudication patterns to estimate collectible revenue, expected adjustments, predicted balance, and payment yield per visit or unit.
For executives, this creates a more realistic view of outstanding accounts receivable than gross charges alone. For billing teams, predicted-versus-actual comparisons can point to visits where payment falls short of expectation and deserves investigation. The purpose is not to replace financial judgment. It is to focus attention on the exceptions with the greatest potential impact.
Make analytics easier to access through plain language
One of the biggest barriers to analytics adoption is knowing which report to run and which filters to apply. Raintree’s planned conversational analytics capability is designed to let users ask a question in plain English, receive a visual answer, and continue with a follow-up question that retains the original context.
For example, a leader could ask for canceled appointments during the past month by location, then ask to break the same result down by appointment type. A useful answer could then be added to a recurring dashboard. Suggested questions can also help users explore a dataset when they do not know where to begin.
Conversational analytics can shorten the distance between a business question and an answer, but governance still matters. Users need trusted data definitions, appropriate permissions and clarity about which fields are available. Natural-language access works best when the underlying data model is already consistent.
A practical framework for turning dashboards into decisions
- Start with the business question, not the report. Define the decision the team needs to make.
- Confirm the metric definition. Make sure every reviewer understands what is included, excluded, and calculated.
- Compare the result with a target, trend, or relevant peer benchmark. A number without context is difficult to act on.
- Drill down only far enough to locate the cause. Use location, provider, payer, case type, or patient detail as appropriate.
- Assign an owner and intervention. Every dashboard review should end with a specific action and follow-up date.
- Return to the same view to measure whether the intervention changed the result.
This operating rhythm is what separates a dashboard from a management system. The technology provides visibility, but the organization creates value by connecting each insight to ownership and follow-through.
Frequently asked questions
What is business intelligence for therapy practices??
Business intelligence for therapy practices combines operational, clinical, and financial data in dashboards and reports so leaders can identify trends, investigate causes, and make decisions. Common use cases include referral conversion, schedule capacity, provider productivity, patient-reported outcomes, denials, and cash flow.
Which dashboards should a therapy practice use?
A balanced BI program should include patient access and conversion, daily operations, provider performance, clinical outcomes and revenue cycle performance. The exact dashboard is less important than whether it answers a clear business question and allows the user to drill into the cause of a result.
How can business intelligence improve therapy practice operations?
Analytics can reveal unworked leads, long evaluation delays, open appointment slots, patients without future visits, cancellation patterns, and documentation backlogs. Teams can then target the workflow, location, or owner responsible instead of applying a broad solution to the entire organization.
How can analytics support therapy revenue cycle management?
Revenue cycle analytics can track DSO, denial rate, aging, payer performance, and predicted collectible revenue. Peer benchmarking and drill-down filters help RCM leaders set realistic targets and concentrate staff on the payers or processes creating the largest gap.
What is conversational analytics in healthcare?
Conversational analytics allows a user to ask questions about trusted healthcare data in plain language and refine the answer through follow-up questions. It can make analytics more accessible, but it still depends on clear metric definitions, reliable datasets, and role-based access.
The central lesson is straightforward: the best analytics environment is not the one with the most reports. It is the one that helps a therapy leader see a problem sooner, understand why it is happening, and guide the right team toward a measurable response